Divided by Design

Part B: The inequities produced by these policies and practices

The previous section described the current policies and practices that ensure our communities and roadways are designed to move cars as quickly as possible. Many of these practices have been inherited from the early interstate age, crafted in many cases by intentionally racist leaders who controlled the decisions about new highways and whose needs would be prioritized by the system overall.

Breaking the cycle of inequitable transportation

Today’s approach is shaped by the past, and it leads to many inequitable and harmful outcomes, including less opportunity for physical activity, increased traffic crashes, increased exposure to air pollution, increased greenhouse gas emissions, and higher household transportation costs. These negative impacts are particularly severe for the most vulnerable populations. To end this cycle, transportation agencies and elected leaders—at all levels of government—must start by understanding and acknowledging how the current policies and standards that guide their decisions are still damaging communities.

They need to understand how their current approach prioritizes certain people and harms others in order to transform that approach.
Car-oriented communities leave millions of Americans vulnerable

The characteristics of our transportation infrastructure and development in many areas across the country create conditions where driving is the only viable option for anyone able to do so—yet this leaves a substantial portion of our population vulnerable. Approximately 28 million Americans (about 9 percent of the population) do not have access to a car, and lower-income people and people of color are more likely to be carless.

Households with an annual income of less than $25,000 are almost nine times as likely not to have a car than households with incomes greater than $25,000. In fact, some 20 percent of households in poverty don’t have a car. Just 6.5 percent of white households did not have access to a car in 2015 according to the National Equity Atlas, compared to 19.7 percent of Black households, 13.6 percent of Native American households, and 12 percent of Latinx households.

People without access to a car do not just live in urban areas; more than one million households— or 6.2 percent of all households—in primarily rural counties do not have a vehicle.1 In fact, the majority of counties in the U.S. with high rates of zero-car households are rural. Carless residents in rural areas also face other unique challenges— for example, while many rural communities have created transit programs that play a critical role in helping people reach healthcare and other needs, fewer communities have the type of scheduled, fixed-route transit that residents can use to get to work every day, making it especially hard for people without access to a car to access employment. The design of our communities can also negatively impact other residents who cannot drive, including older adults and some people with disabilities.

A 2018 survey from the National Aging and Disability Transportation Center found 40 percent of adults over age 65 cannot do the activities they need to do or enjoy doing because they cannot drive. 40 percent of the survey respondents cited access and availability of affordable transportation as a barrier, and respondents regularly described feeling dependent on others, frustrated, isolated, and trapped after giving up driving. An estimated 25.5 million Americans have disabilities that make traveling outside the home difficult, according to the Bureau of Transportation Statistics, and people with travel-limiting disabilities are less likely to have jobs.
Our roads are deadly for people walking, especially for already-disadvantaged populations

In many communities, traveling outside a car can be a matter of life and death. Our policies and practices have created a system that prioritizes high-speed car trips over all other modes, and people of color and low-income communities pay the price.

Pedestrian fatalities began steadily rising in 2009, and the trend has not slowed down. 7,341 people—more than 20 per day—were struck and killed while walking in 2021, a massive 12.4 percent increase over 2020. Comparing 2021 to 2019, when travel behavior was more similar to 2021 than the shutdown-laden year of 2020, that increase goes up to an astonishing 17 percent. This record high also marks an astonishing 79 percent increase since 2009.


Our roads are deadly for people walking, especially for already-disadvantaged populations

A woman in a powered wheelchair tries to safely travel around Jackson, MS. Photo courtesy of Scott Crawford.

Speed or Safety

The design of our roads produces these dangerous conditions for people walking: wide lanes, large distances between traffic signals, and long unobstructed lines of sight make it feel safe to drive fast—often significantly faster than the posted speed limit—and drivers unconsciously follow these visual cues. For people on foot, the likelihood of surviving a crash decreases rapidly as speeds increase past 30 mph.

A racial and economic divide
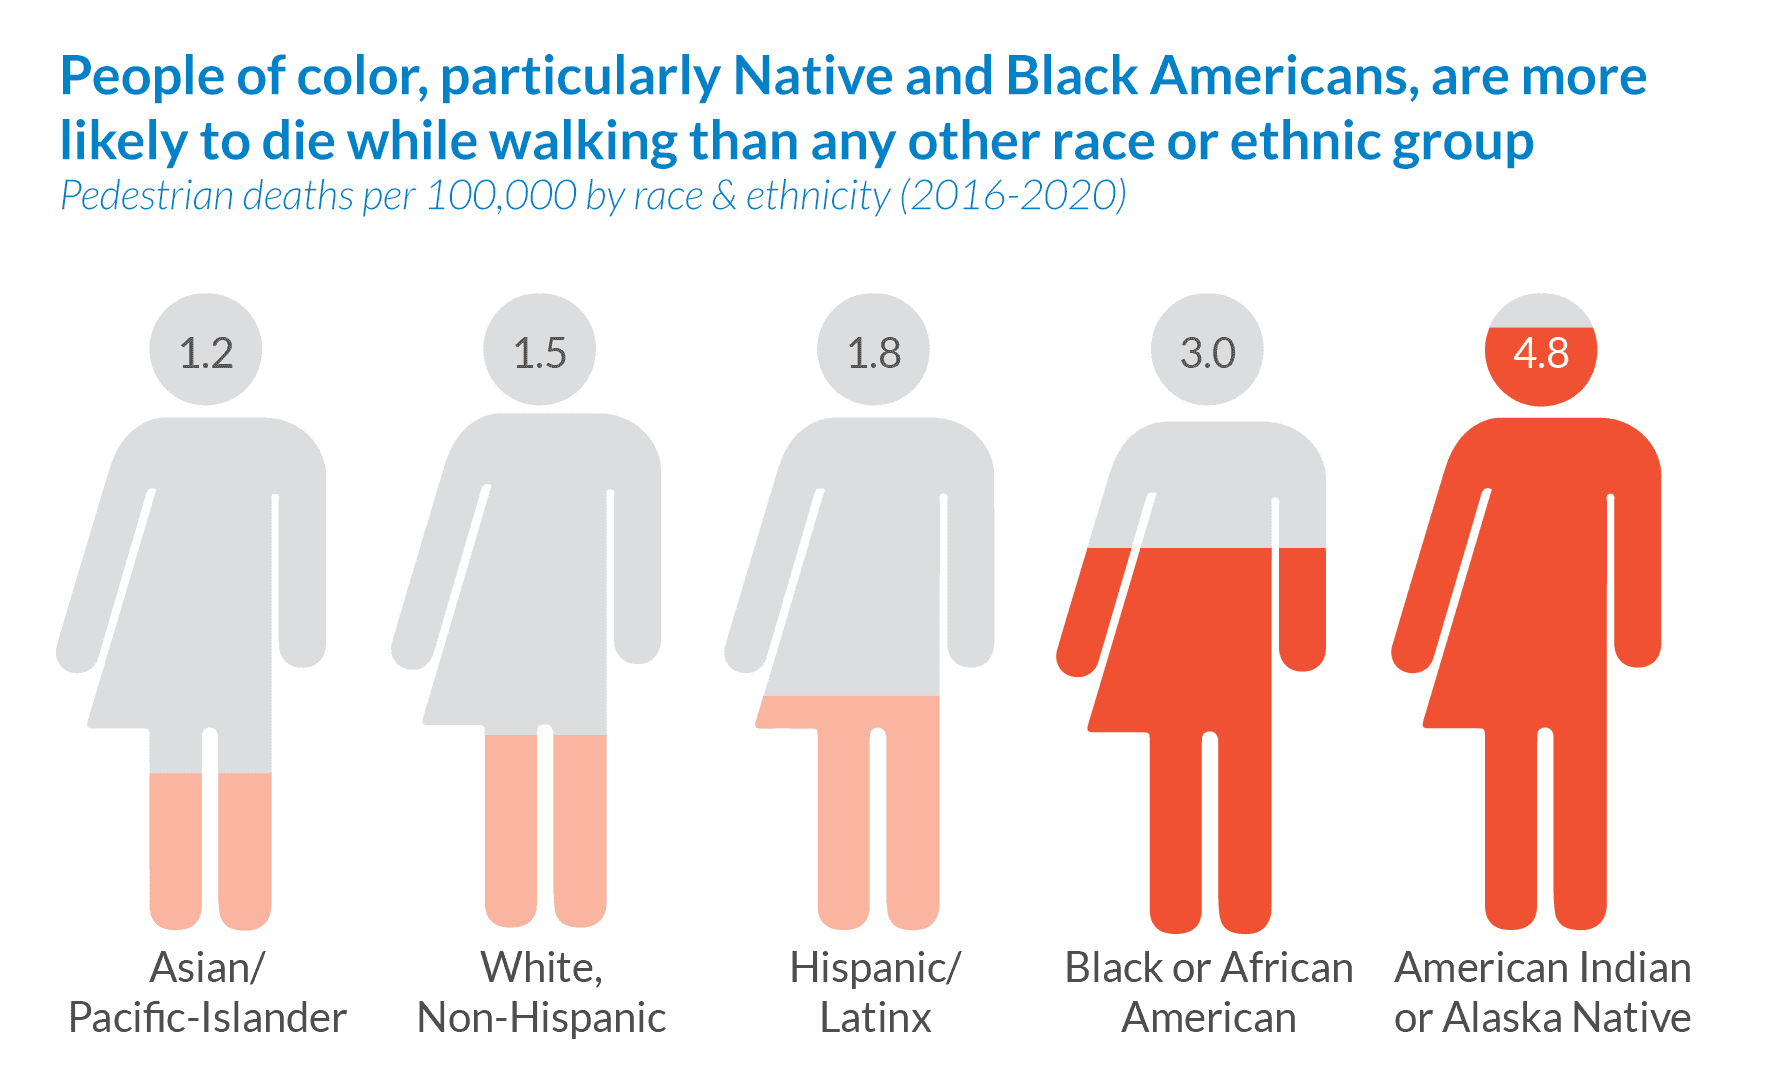
Because highways were and continue to be intentionally placed through communities of color, and because this placement often results in less economic opportunity in these areas, the burden of dangerous street design is not shared equally. People of color and people walking in low-income communities are disproportionately represented in pedestrian traffic deaths.

Even after controlling for differences in population size and walking rates, drivers strike and kill older people, people of color, people over age 50, and people walking in communities with lower median household incomes at much higher rates.

Too often we rely primarily or exclusively on enforcement to manage speeding instead of addressing the causes of speeding like roadway design to change driving behavior. This overreliance on police enforcement disproportionately imperils Black motorists and other demographics subject to profiling and violence. Automated enforcement mechanisms, disproportionately placed near communities of color and often enforced through fines, also disproportionately impact drivers of color.


A family walks along a substandard sidewalk next to Martin Luther King. Jr. Highway near Landover, MD.
Photo by Steve Davis, Smart Growth America.

Growing traffic, more pollution, and poor health outcomes

Car-oriented development, embedded in our status quo approach, has had other negative consequences for American communities: more driving means more transportation emissions, more traffic, and often poor health outcomes. People of color and low-income communities experience these impacts at disproportionate rates.

Read More

Failure to supply the growing demand for walkable, transit-rich communities price out those who most need affordable transportation options

While most communities across the U.S. are primarily car- oriented, demand has clearly pivoted. Six out of 10 people said they drive because of a lack of other options in a 2017 survey, 62 percent of Americans reported that nearby transit would be important in choosing where to live and 54 percent cited nearby bike lanes and paths. Companies of all sizes are also relocating to or deciding to start up in walkable downtowns and communities with transit to ensure access to a high-quality workforce, as younger talent flocks to transit-connected, walkable communities.

In spite of this demand, zoning laws and transportation agency policies often do not allow for this type of dense, walkable environment. As a result, the market has not been able to respond to the demand for walkable communities, making them more expensive. Americans today are forced to pay a premium for housing in walkable communities and accessible transit.

Due to the growing deficit of affordable housing in cities and walkable communities, low-income families and individuals have been pushed to the suburbs, further away from jobs and services and with fewer options for traveling without a vehicle. A study by the Brookings Institution found that residents in low-income suburban neighborhoods with access to transit can reach just four percent of metro area jobs with a 45-minute commute. In other words, many people without access to a car are also unable to get to work without a car, creating a cycle of poverty.


People dislocated by past highway projects are dislocated again
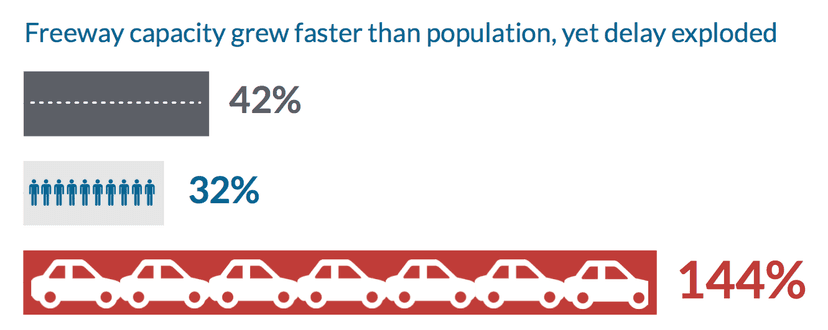
To reduce delays and increase speeds, decision- makers are willing to spend billions of dollars on new roadway lane-miles in an effort to solve congestion. This effort has failed repeatedly, and communities of color are paying the price. In the 100 largest urbanized areas in the U.S. the number of freeway lane miles grew by 30,511 between 1993 and 2017, an increase of 42 percent.

That rate of expansion significantly outstripped the 32 percent growth in population in those regions over the same time period, yet annual hours of delay (a standard measure of congestion) grew by a staggering 144 percent. In fact, congestion increased in every single area, including those with stagnant or declining populations.

People dislocated by past highway projects are dislocated again

This has not stopped urban areas from continuing to expand highways. In the last three decades, more than 200,000 people nationwide have lost their homes to federal road projects. The overwhelming majority of people forced from their homes are people of color.

It is likely true that, as transportation planners maintain, highway expansions are less destructive than building new highways through cities. However, because highways were historically placed in communities of color, expanding these same roadways can only result in displacing members of these communities again.

Download Divided by Design 2023

Download Report
img
logo
1350 I St NW Suite 425 Washington, DC 20005
info@smartgrowthamerica.org

Subscribe to our newsletter

Livable places. Healthy people. Shared prosperity.

© 2025 Smart Growth America. All rights reserved

Accessibility