Dangerous by Design

State of the States

Uncover the urgent truths behind America’s rising pedestrian fatalities and explore transformative solutions to create safer, more inclusive streets for everyone. Join us in reimagining our roadways—prioritizing people over cars to protect lives.

State Findings

Notable Findings
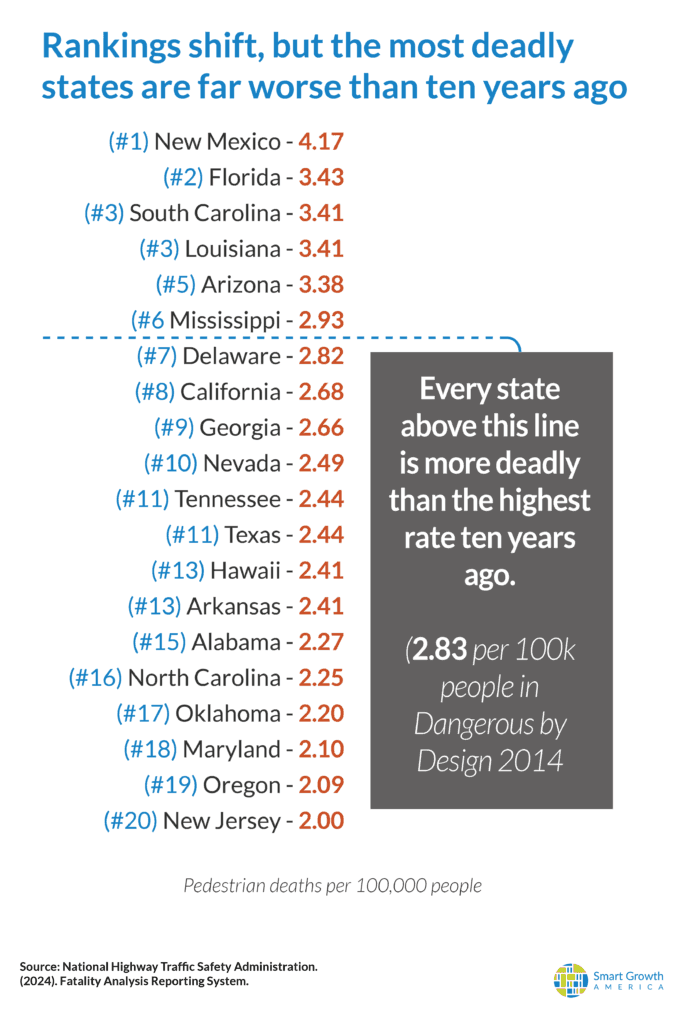
New Mexico reaches top spot and historic levels. The rate of death (per 100,000 people) increased 65 percent over the decade from 2013 to 2022, from 2.53 up to 4.19. In absolute terms, these deaths have nearly doubled over that period, increasing by 90 percent. New Mexico is also getting worse faster than other states—New Mexico had the second largest increase in the rate of death (+1.03) when comparing average rates for consecutive five-year periods. To put that long-term increase in perspective, the total pedestrian fatality rate in the United Kingdom in 2022 (0.57 deaths per 100k people) was approximately half of New Mexico’s long-term increase.

All but two of the 20 most deadly states are getting worse. Only Delaware (-0.30) and Nevada (-0.09) in the top 20 saw improvements in their long-term fatality rate (comparing average rates for 2013-2017 to 2018-2022). The rest of the 18 most deadly states are growing more deadly.

Six other states are trending less deadly, though most with only modest gains. Rhode Island saw the biggest improvement of any state at -0.50. The other five states trending less deadly only saw modest improvements, with a -0.31 total cumulative decrease in MA, ME, NH, NY, and UT added together. While these decreases are relatively small, it’s worth noting that eight total states improved in this report, compared to just four in our 2022 report.


Notable Findings

The top 20 shifts, but the song remains the same. While rankings have shifted around compared to our last edition of this report in 2022, the list of states included in the top 20 are the same.

State transportation agencies own and control the most dangerous roadways. Nationally, from 2018-2022, 54 percent of the deaths of people struck and killed while walking occurred on streets and roads owned by states.

Black people were killed while walking at rates higher than the national rate for all persons (with a minimum of 30 deaths from 2018-2022). Within those 27, 13 states have a rate that is almost twice as high as that national rate, or higher. (4.00 per 100k or above).

The Centers for Disease Control and Prevention provided support for data analysis and synthesis used in the report under cooperative agreement OT18-1802 supporting the Active People, Healthy NationSM Initiative, a national initiative led by the CDC to help 27 million Americans become more physically active by 2027.

Learn more: https://www.cdc.gov/physicalactivity/activepeoplehealthynation/index.html. The findings and conclusions in this report are those of the authors and do not necessarily represent the official position of the Centers for Disease Control and Prevention.

Download Dangerous By Design 2024 State of the States

Download Report
img
logo
1350 I St NW Suite 425 Washington, DC 20005
info@smartgrowthamerica.org

Subscribe to our newsletter

Livable places. Healthy people. Shared prosperity.

© 2025 Smart Growth America. All rights reserved

Accessibility